

It's the Count, Dummy
It's the Count, Dummy
The only thing that matters in Baseball

For as long as I can remember I have loved baseball. What baseball lacks in frenetic action, it makes up for in its individual battles and continual strategic adjustments. In addition to the sport itself, I have always found the application of analytics to gain a competitive advantage enthralling. Despite the complex and ever-evolving landscape of baseball analytics, perhaps the most important, yet simple, deterministic factor in all of baseball is the count.
As the cliche goes, the battle between a pitcher and a batter is a chess match. Every pitch alters the likely outcome of the at bat, and each at bat changes the outcome of the game. You can't watch a baseball game on television without hearing the announcers mention the count and the advantage the count in question gives to the batter or the pitcher. But how advantageous is a "hitter's count" or a "pitcher's count" for the given hitter or pitcher?
Let's define three statistics that I'll be referring to throughout this article. On-base percentage is the percentage of time a player reaches on base via a hit, a walk, or being hit by a pitch. Slugging percentage is calculated by dividing total bases by at bats. A single is one total base, a double is two bases, etc. Note that walks don't function into slugging percentage. The formula for slugging percentage is given as (singles + 2*doubles + 3*triples + 4*Homeruns)/AB. On-base plus slugging (OPS) is a simple, yet informative baseball statistic which sums a players on-base percentage and their slugging percentage. It melds a player's ability to get on base and to hit for power into one number.
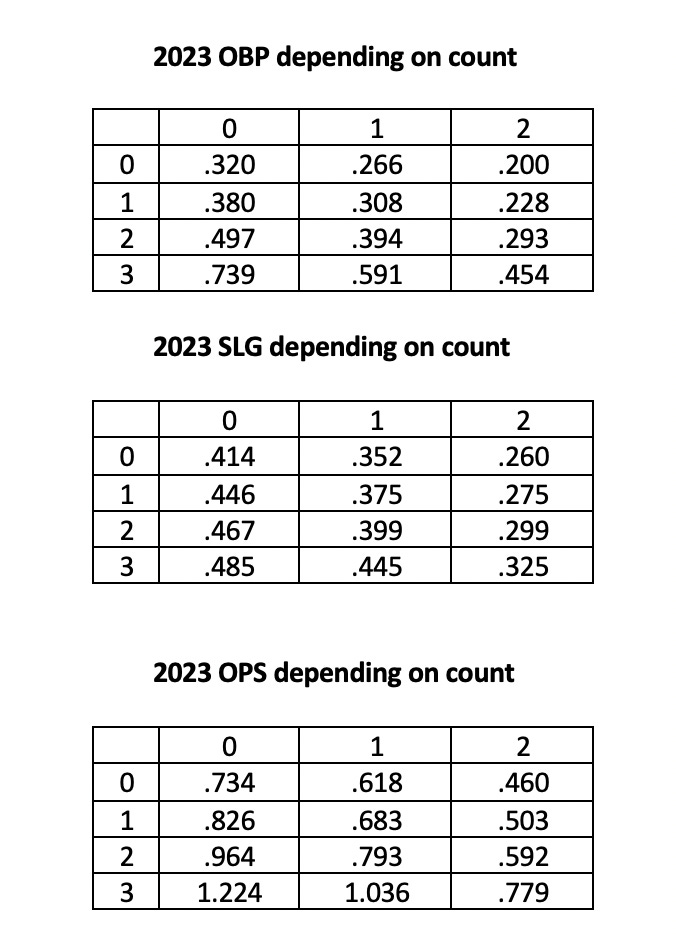
In 2023, the league average on-base percentage (OBP) was .320 and the league average slugging percentage (SLG) was .414, resulting in a league average OPS of .734. Put simply, in 2023 you had a 32% chance of getting on base during a plate appearance and 0.414 expected total bases per at bat.
The beauty of baseball lies in its ability to be dissected into individual instances and even smaller events, with the likelihood of an outcome varying dramatically with each sub-occurrence. Baseball is made up of 9 innings, 27 outs, and, in 2023, 37.88 plate appearances per team and 3.91 pitches per plate appearance on average. That means that, on average, there were 296 pitches per game, each with its own associated probability.
First Pitch
This is most evident when considering the league average, OBP, SLG, and OPS after a plate appearance reached a certain count. For simplicity, each pitch thrown results in four possible outcomes: a ball, a strike, a hit, or an out. As mentioned prior, when a player stepped into the batter's box in 2023 they had 32% chance of getting on base during a plate appearance and 0.414 expected total bases per at bat, resulting in a .734 OPS. Let's say the first pitch of the plate appearance results in a ball, and the count is 1-0 (one ball and no strikes). From just that one pitch, the expected outcome dramatically shifts. Now, the hitter holds a 38% probability of reaching base and is expected to gain 0.446 total bases in that at bat. This one pitch leads to an OPS of .826, a 12.53% increase from the start of the batter's at bat.
Conversely, let's consider the case were the first pitch of the at bat is a strike. In this scenario, the batter's probability of reaching base drops to 26.6% and is now expected to gain just .352 total bases in the at bat. The corresponding OPS of .618 represents a 15.8% decrease from the beginning of the at bat, and is 25% lower than the expected OPS if the at bat began with a ball.
One Strike
If we were to define the most important pitch thrown in an at bat as the largest percentage difference between being called a ball or a strike, then there is no more important count than 2 balls and 1 strike. With the count 2-1, the batter has a 39.4% chance of reaching base safely and is expected to gain .399 bases, resulting in a .793 OPS. A ball sees the batter's OPS rise to 1.036, while a strike drops their OPS to .592. Much of this has to do with strikeout and walk percentages.
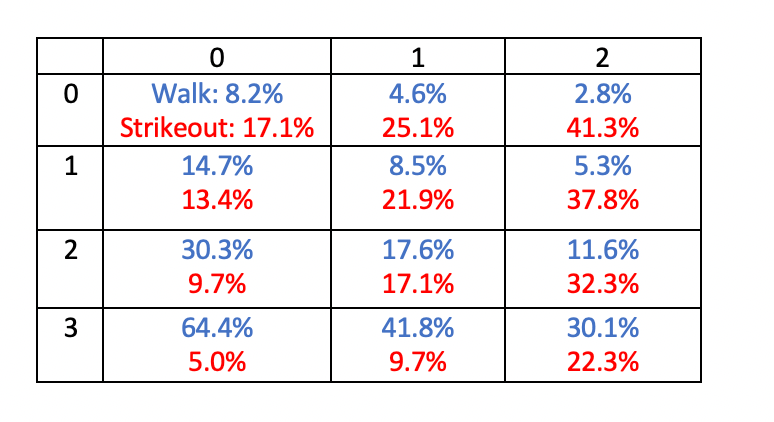
Using data from 1957-2019, on a 2-1 count the batter has a 17.6% chance of walking compared to a 17.1% chance of striking out during the plate appearance. On a 3-1 count the batter's walk right more than doubles to 41.8% while their strikeout rate nearly halves to 9.7%. From 2-1 to a 2-2 count, the batter's walk rate decreases 34% from 17.6% to 11.6% while their strikeout rate nearly doubles from 17.1% to 32.3%. This pivotal shift in walk and strikeout percentage plays a large role in the 54.5% difference in OPS from a 3-1 count compared to a 2-2 count.
Full Count
A full count guarantees the conclusion of the plate appearance. Sure, the batter could foul off a pitch or two, but regardless, 3-2 will be the count for the duration of the plate appearance. There are two interesting things of note. Firstly, the OPS associated with a 3-2 count is .779, 6.1% higher than the average OPS for a plate appearance. Secondly, despite a higher OPS, the SLG associated with a 3-2 count is 21.5% lower than the average SLG for an at bat. This of course, has to do with strikeout and walk percentages.
Using our data from 1957-2019 (and assuming 2023 isn't particularly anomalous), we see that while the strikeout to walk ratio for a given plate appearance is more than 2:1 (17.1% compared to 8.2%), on a full count the strikeout to walk ratio is approximately 2:3 (22.3% compared to 30.1%). Therefore, again assuming 2023 isn't an anomaly, on a full count a batter gets on base 45.4% of the time, walking 30.1% of the time. This means that only 15.4% of full counts result in a hit. Recall that SLG is defined as the (singles + 2*doubles + 3*triples + 4*Homeruns)/AB. Since walks don't factor into SLG and the batting average associated with a full count is significantly lower than for an average at bat, the SLG associated with a full count is lower than the average SLG for an at bat.
Interestingly, in 2023 pitchers threw 57% of their pitches in the strike zone on a full count compared to 49% in all other counts, a 16% increase. Batters swung at 70% of pitches on a full count compared to 46% in all other counts, a 52% increase. In short, hitters feel more pressure to increase their swing rate than pitchers do to up their zone rate in a full count. If this is the case, why is the walk percentage higher than the strikeout percentage?
Put simply, it's all about foul balls. With 0 or 1 strikes a foul ball adds a strike to the plate appearance, changing the count and the altering likelihood of a given outcome. With two strikes, a foul ball doesn't change the count and therefore there is no associated probability change in the expected outcome. It's essentially as if no pitch was even thrown. Therefore, since a foul ball doesn't "penalize" a batter by adding a strike to the count, there is less of a negative incentive to swing on a 3-2 count (or any two strike count) than when there is 0 or 1 strikes.
………
In Major League Baseball there are good hitters and there are bad hitters, but even the best hitter in a disadvantageous count will perform worse than the worst hitter in an advantageous count. In 2023, Steven Kwan was the best hitter in an 0-2 count, while Luke Maile was the worst hitter with a 3-1 count. Despite this, Steven Kwan still had a lower OPS in an 0-2 count than Luke Maile did in a 3-1 count.
When you watch baseball, anything can change on any given pitch, but not all pitches are equal. What happens on the first pitch dictates the rest of the at bat. A first pitch strike, and the average hitter's OPS becomes 15.8% below average. A first pitch ball, and that same hitter sees their OPS rise 12.5% above average. In an analytics driven sport where seemingly every piece of data is available and analyzed, nothing matters more than the count.