

Introduction: Our Population is Shrinking, Who Cares?
In 1960, the United States had a total fertility rate (TFR) of 3.44. As of 2022, the United States' TFR sat at 1.78, a 48.3% decline. Taking into account infant mortality rate and the human sex ratio, a total fertility rate (TFR) of 2.1 is considered to be replacement-level fertility. Therefore, any rate below 2.1 would indicate a decrease in population, while any rate above 2.1 would indicate a population increase. In 1960 the United States was growing; in 2022, the United States is shrinking.
With many attracted by neo-Malthusean concerns of overpopulation, there is surely widespread ambivalence or even contentment with these demographic trends. Why does low fertility even matter?
Integrally, low fertility produces rapidly aging populations and possible country-level population decline. This has drastic implications for labor force participation, economic growth, and government budgets. Economic behavior and needs vary dramatically over people's lives. During childhood and old age, people consume more than they produce through their labor. This gap is addressed by relying on accumulated assets, but most importantly through public and private intergenerational transfers which shift resources from some generations to others. Private transfers transpire when parents raise their children or when adult children assist their elderly parents. Public transfers consist of public education, health care, public pensions, and the taxes which pay for these programs. As the United States grows older, there will simultaneously be a greater demand for healthcare and pensions and fewer young people available to pay the taxes and consume the goods needed to sustain a society and to sustain pensions, healthcare, and other necessities. The social systems which we implicitly agreed upon won't be able to sustain themselves — public and private transfers will decrease, and Americans will resort to postponing retirement and accumulating more assets in order to sustain themselves in later life.
These practical economic factors have numerous social and cultural implications as well. A larger proportion of older individuals in the population can impact intergenerational dynamics. As there become fewer younger people capable of supporting and caring for an aging population, social tensions and resentment will inevitably brew. With all of these factors considered, understanding the variables affecting TFR are integral to ultimately alleviate the crisis.
Three Periods of Fertility Rates
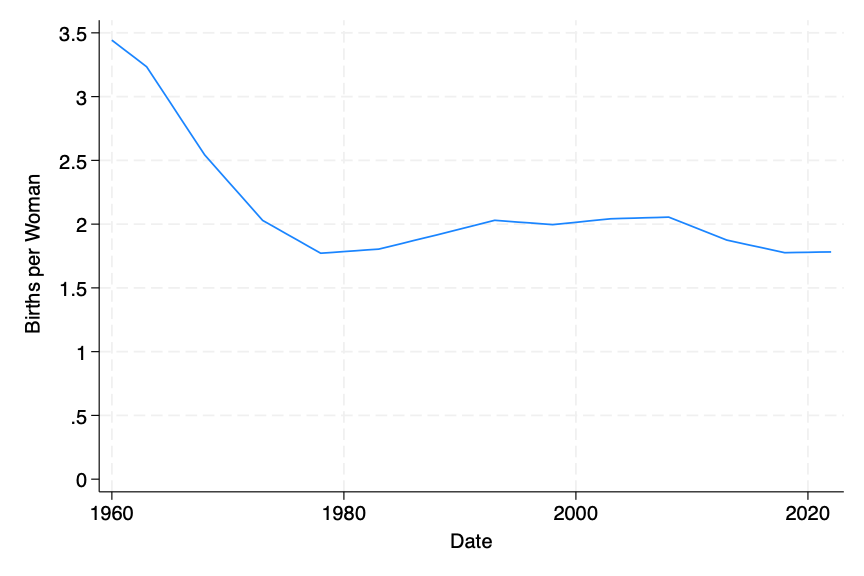
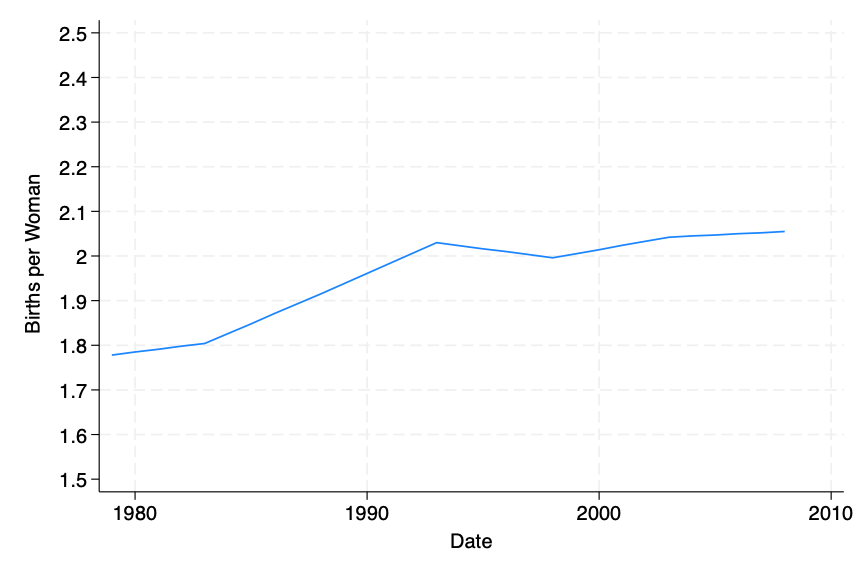
Looking at the graph for the number of births per woman from 1960 to 2022, it's clear that the narrative is more complex than a simple a drop in TFR over time. Three separate periods emerge: a precipitous drop in TFR from 3.44 to 1.77 from 1960 to 1979, a resurgence from 1.77 to 2.06 from 1979 to 2008, and a decline from 2.06 to 1.78 from 2008 to 2022. After spending numerous days trying to analyze the reasons behind these shifts in TFR, I realized that these periods are dependent on cultural, economic, and politics trends which emerge and fade over time. That is to say, there is no statistically significant relationship between TFR and any variable I considered over time, but there are variables that clearly explain each of those three separate periods. Let's consider each of these periods, and the variables that influences the subsequent shifts in TFR.
The Great Decline: 1960 to 1979
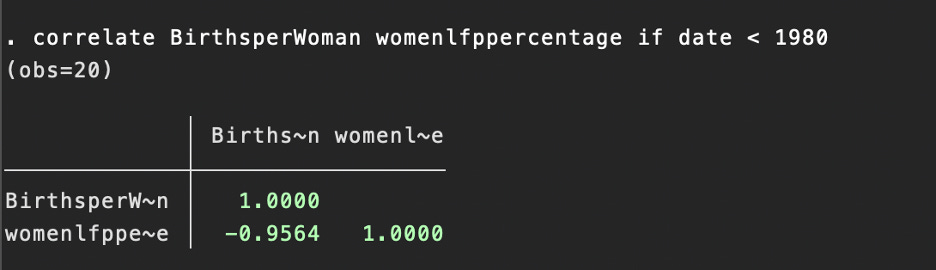
Much of the conventional wisdom regarding the drop in TFR centers around the emergence of feminism in the 1960's, and the shift towards women increasingly entering the workforce. To a certain extent, conventional wisdom prevails. Looking at the correlation between TFR (labeled as Birthsperwoman) and the percentage of women in the labor force (labeled at womenlfppercentage) between 1960 and 1979 we see that there is almost perfect negative correlation.
Running a linear regression with Birthsperwoman and womenlfppercentage we see that womenlfppercentage is statistically significant, and has an R-squared of 0.9147. Note how the coefficient on womenlfppercentage is -0.1348, meaning that a one percent increase in women entering the labor force corresponded with a decrease in TFR of 0.1348.
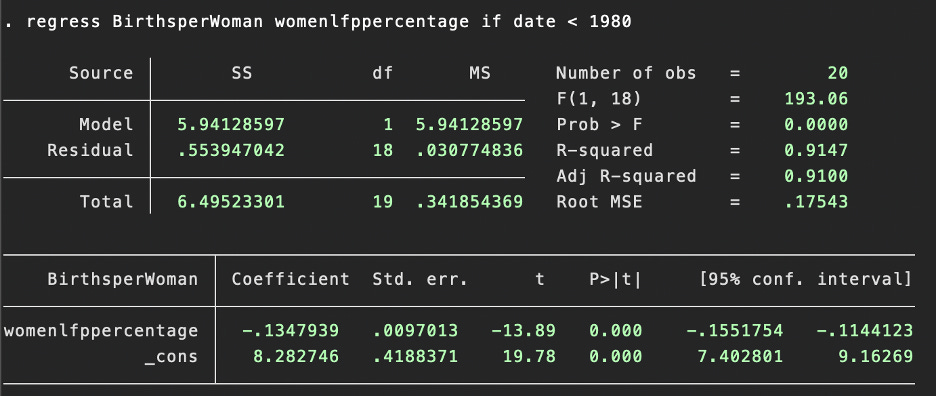
In order to demonstrate the strength of the relationship between TFR and the percentage of women in the labor force during this period, I'll create a variable using the estimated equation from the linear regression. Calling this variable birthpredictor2 and using the output from the linear regression shown at the bottom of the image, we get that birthpredictor2 = 8.282746 -.1347939*womenlfppercentage.
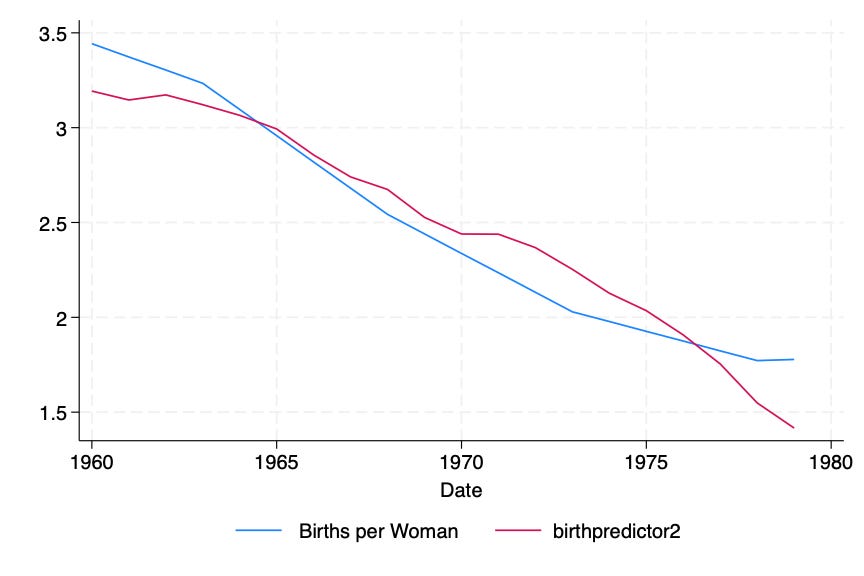
Graphing the actual TFR rate (shown in blue) and the estimated equation from the linear regression shown in red, it becomes evident just how effective the rise of women entering the labor force is in explaining the drop in TFR over this period.
Something really intriguing emerges, however, when you consider the relationship between women entering the labor force and TFR following this initial dramatic drop in fertility rate.
Note only is the relationship less significant, but it is positive! That is, rather than increases in women labor force participation decreasing TFR, following it actually increases it. Therefore, although conventional wisdom is correct that women entering the workforce proved incredibly statistically significant in the initial drop in TFR, it only explains the period from 1960 to 1979. With this in mind, let's consider the "baby boom" which occurred from 1979 to 2008.
The "Baby Boom:" 1979 to 2008
From 1979 to 2008 TFR grew from 1.77 to 2.06, an increase of 16.4%. Much of this can be intuitively explained by the increase in immigration in the United States. In 1979 the immigrant population in the United States sat at 13,633,840, accounting for 6.1% of the total population of the country. By 2008, the United States' immigration population ballooned to 38,186,300 and accounted for 12.5% of the country's population. While it is difficult to find reliable data for immigrants' TFR going back to 1980, the TFR for immigrants in 2008 was 2.75 — about 0.7 births per woman higher than the national average. With more immigrants entering the country and making up a higher country it makes sense that, given their higher TFR than the national average (and even higher TFR than the native-born population), intuitively one would expect a strong relationship between TFR and immigration. Looking at the correlation between both TFR and immigrant rate, and TFR and women entering the labor force we see very strong positive correlation in both cases.
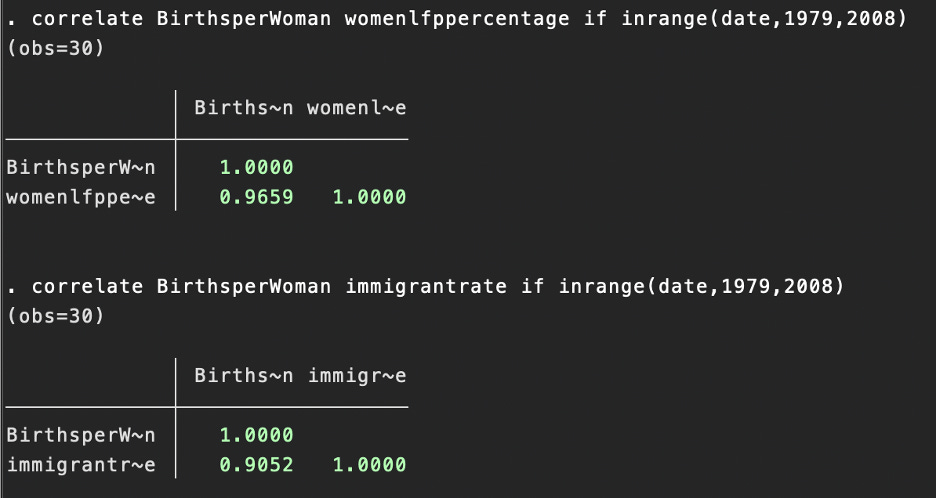
Running a linear regression, we see that both are statistically significant variables, and the linear regression has a very high R-squared of 0.9443. Interestingly, womenlfppercentage is more correlated with BirthsperWoman than immigrant_rate, is more statistically significant in the linear regression, and has a larger associated coefficient. This intuitively doesn't make much sense, and contradicts the relationships between TFR and women entering the workforce found during the period from 1960 to 1979. My proposed explanation would be the social shifts regarding child-rearing and increase in childcare services. Historically childcare was primarily handled within the family, with women primarily bearing the responsibility for taking care of children. As women increasingly entered the workforce, there became a market demand for formal childcare services. This led to the establishment of childcare centers and daycare facilities to meet the needs of working parents. With much of the child-rearing labor able to be outsourced, women entering the workforce became more associated with two-income households and economic prosperity, which helped increase TFR. Unfortunately, there is very little attainable data on childcare services over time meaning that my explanation is nothing more than a hypothesis. With that said, the limited data I did find, though insufficient for statistical analysis, does seem to point to the potential validity of this child-rearing hypothesis.
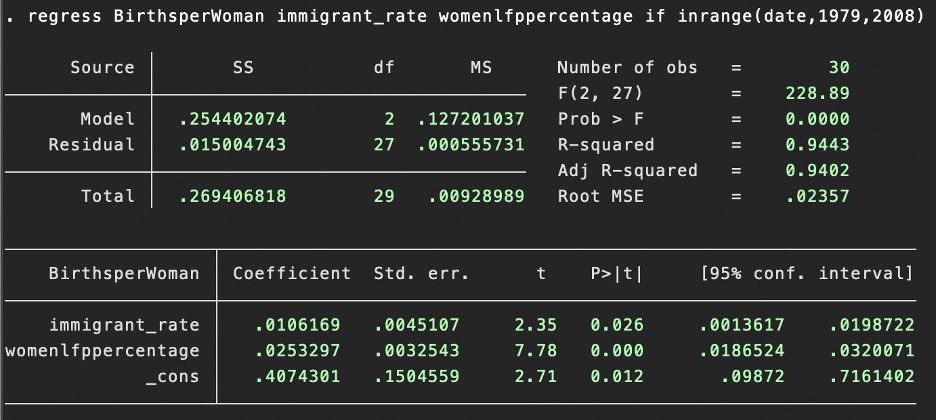
Returning to the data, let's create a variable using the estimated equation from the linear regression. Calling this variable TFRboom and using the output from the linear regression shown at the bottom of the image, we get that TFRboom = 0.4074301 + 0.0106169*immigrant_rate + 0.0253297*womenlfppercentage.
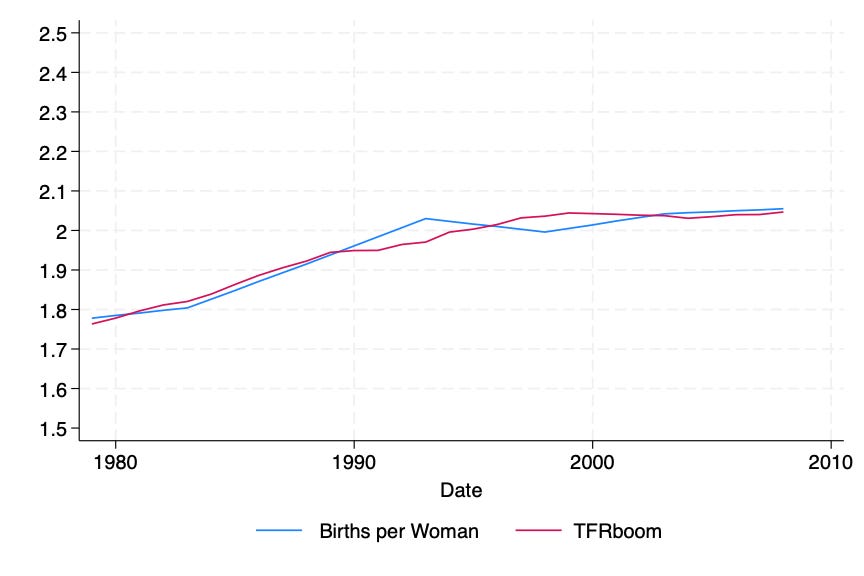
Graphing the actual TFR rate (shown in blue) and the estimated equation from the linear regression shown in red, it becomes evident just how effective the prevalence of immigration and the rise of women entering the labor force are in explaining the increase in TFR over this period. While, these relationships hold pretty steadily for about 30 years, the Great Recession turned the American economy and American TFR on its head.
The Fertility Recession: 2008 to 2022
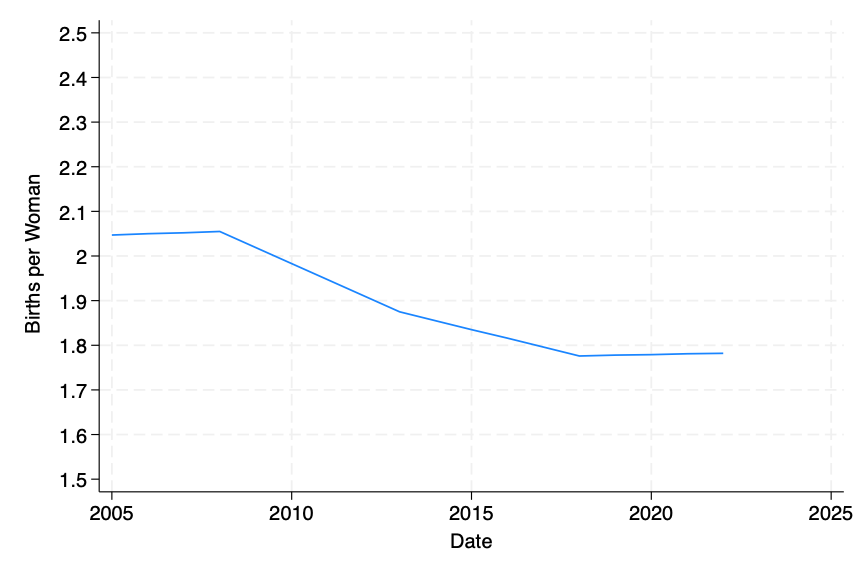
From 1979 to 2008 TFR dropped from 2.06 to 1.78, a decrease of 13.6%. Much of this can be explained by the social and economic shifts following the Great Recession. Perhaps the two most significant variables in this decrease in TFR which were precipitated by the Great Recession were homeownership rates and marriage rates. The marriage rate dropped from 7.1 marriages per 1000 people in 2008 to 6 marriages per 1000 people in 2022. While less significant, the homeownership rate similarly decreased from 67.83% to 65.5% between 2008 and 2022. During the time frame both of these variables proved to have fairly strong positive correlations with TFR.
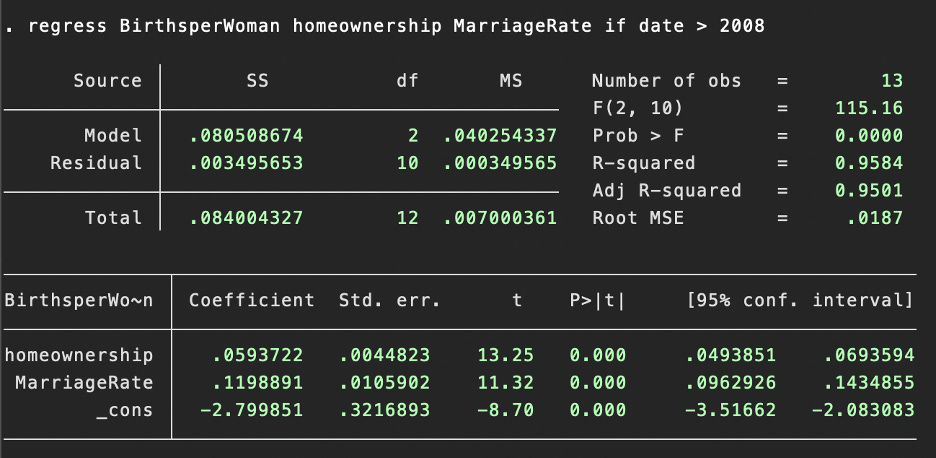
Running a linear regression, we see that both are statistically significant variables, and the linear regression has a very high R-squared of 0.9584. Creating a variable, postrecessionbirthpredictor, using the estimated equation from the linear regression, we get that postrecessionbirthpredictor = -2.799851 + 0.1198891*MarriageRate + 0.0593722*homeownership.
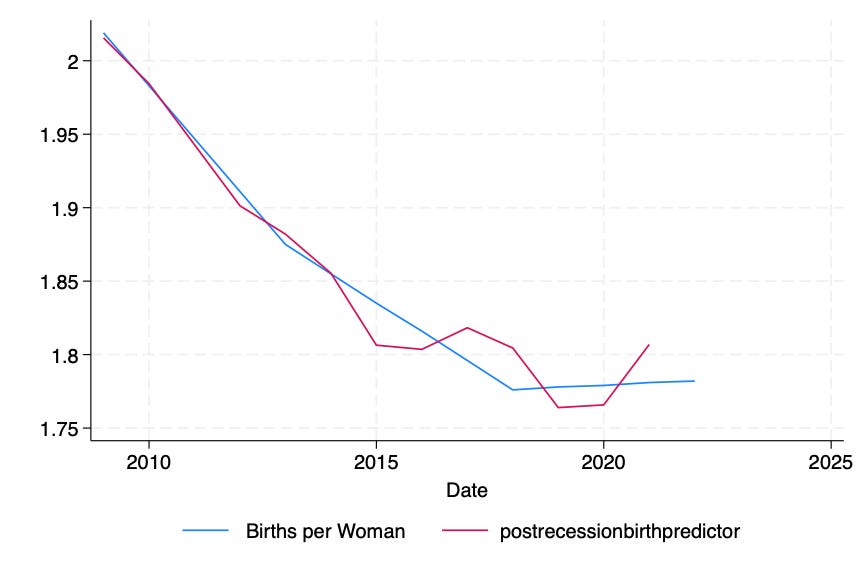
Graphing the actual TFR rate (shown in blue) and the estimated equation from the linear regression shown in red, we see visually how significant the drops in marriage rates and homeownership were in explaining the drop in TFR over this period.
2021 Analysis by State
While we've considered the various factors which influenced the TFR over time, let's now consider an statewide analysis using data from 2021 to elucidate the factors that cause different birthrates across the country. While this analysis isn't very extensive, I considered three variables which I assumed would be informative: median household income, percentage of women in the labor force, and religious affiliation per 1000 people. Additionally, since TFR data was not available for individual states, I used births per 1000 women and called this variable fertility.
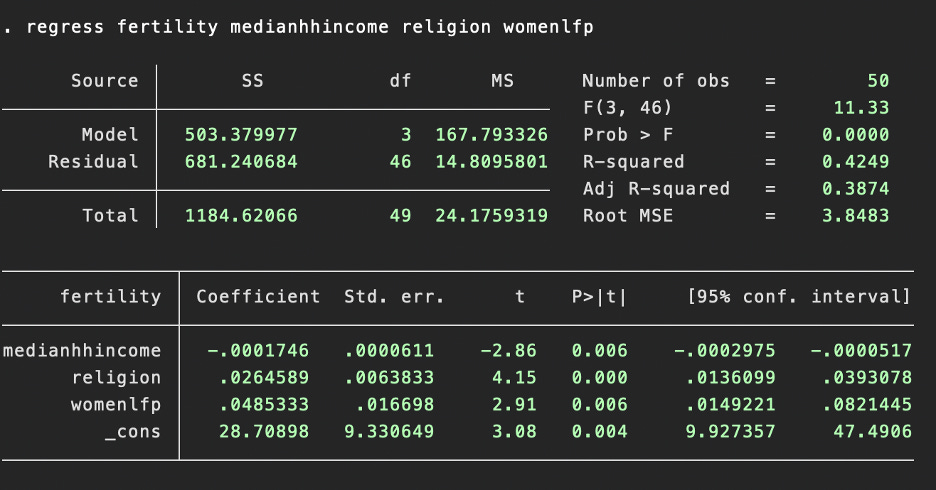
Running a linear regression, we see that all three independent variables — medianhhincome, religion, womenlfp — are significant. Religion though is the most significant variable, with a t-statistic of 4.15.
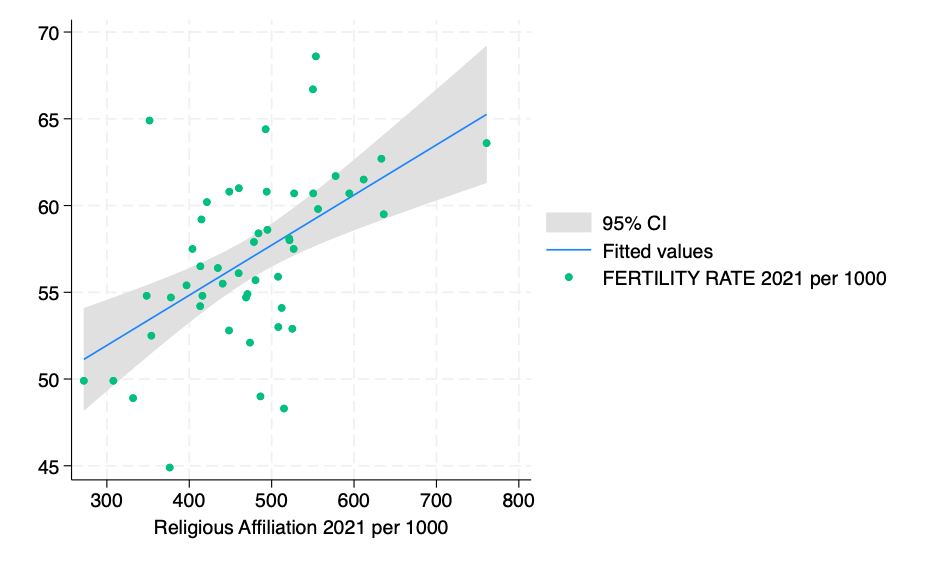
Graphing a scatterplot with fertility rate and religious affiliation, we see that, particularly on the extremes, there seems to be some positive relationships between religion and fertility. That being said, the relationship isn't incredibly strong, and religious affiliation per 1000 people is a subjective term where religious affiliation could mean different things to different survey respondents. Regardless, however intuitive as it seemed prior to any analysis, religion seems to be positively related to fertility rates.
Conclusions: What can be done?
Ultimately, this analysis demonstrated to me how complex the issue of TFR is, and how many factors influence it over time. Firstly, we can very quickly debunk two solutions proposed by conservatives and liberals for increasing TFR. The conservative proposal centers on an exodus of women from the labor force and a return to the single-income economy. Without even considering the political, social, and economic difficulties associated with such a proposal, this analysis found that following that dramatic drop in TFR from 1960 to 1979, not only did women labor force participation not negatively affect TFR, but it actually was positively correlated with them. Therefore, this proposal can immediately be disregarded. The more interesting proposal put forth by liberals, is that of increased immigration. It is true that one of the primary factors in increasing TFR from 1979 to 2008 was the influx of immigrants entering the country. That being said, there are two issues with this proposal. Firstly, the fertility rates of immigrants in the United States have been found to decrease sharply in the second generation. Secondly, immigrant fertility has declined more rapidly than that of native-born women. In 2008, immigrant women had a TFR of 2.75 children; by 2019 it had fallen to 2.02 — a 0.73-child decline. To put this into perspective, in 2009 South Dakota, the highest TFR by state, had a TFR of 2.08. With these factors considered, at best increased immigration is a short-term band-aid to a much larger issue of declines in TFR.
Waiting for another religious great-awakening or any other significant social and cultural shifts to emerge, while possible, isn't appropriate considering the severity of the issue at hand. One prescriptive answer, though, might be found by looking to Germany. A study undertaken by Stefan Bauernschuster, Timo Hener, Helmut Rainer looked at the role that affordable and widely available public childcare played in fertility in Germany. Applying a difference-in-differences method which compared a treatment group of German counties with above-median childcare expansion to a control group of counties with below-median childcare expansion over time, they found that childcare expansion has a statistically significant positive effect on fertility. More specifically, they found that a "10 percentage point increase in childcare coverage leads to an increase in birth rates of 2.8%."
If we are concerned about suboptimal fertility rates, the study in Germany appears to indicate that universal early childcare might offer the promise of being an effective means of increasing birth rates. While it is necessary to conduct comprehensive studies to truly understand the potential impact that universal childcare would have on fertility rates for Americans, this study offers a potential means to address the issue of worryingly low TFR. Whether or not universal childcare is the ultimate solution, we must take the steps to make childrearing as accessible as possible in order to address the issue of low fertility rates.
Max, this is a very interesting piece of research.
I knew generally about replacement rates and the associated problems with low birth rates, but this was an eye-opener on the historical situation and probable causes. As for conclusions, I am all for the conservative suggestion, as you might guess, but am realistic enough to know that is not likely. Very well thought out and explained. Thank you!